
GLOBAL Air quality map
A free visual tool for all those who seek to obtain local air quality information, anywhere

eLichens’ Global Air Quality Map is a free tool for citizens, communities and organizations who are curious about local pollution and are willing to take positive action to improve their quality of living.
eLichens’ Global Air Quality Map uses our proprietary patented models to display real-time and future air quality data with the highest resolution.
Your local air quality anywhere in the world
Forecast up to 24h · AQI · NO2 · O3 · PM10 · PM2.5
· Weather · Pollen Map
KEY FEATURES
A high-resolution world map (5 meters) with a straight-forward layout and intuitive color codes
Real-time air quality data worldwide: up-to-date Air Quality Index (AQI) and concentrations
for the most relevant ambiant pollutants: Particulate Matter 2.5 and 10 (PM), Carbon Dioxide (CO2), Ozone (O3), Nitrogen Dioxide (NO2)
Real-time measurements from eLos Air Quality Stations and Local Air Quality Agencies
Street-level pollution for 300 global cities: eLichens’ model provides the most accurate information at a hyper local scale
Short-term forecast: hourly forecast data for up to 24 hours
eLichens’ AQI: a consolidated index that is suitable for global users and is based on the AQIs of the US EPA and the EU Citeair
Free and unlimited for all, accessible everywhere
eLichens Air mobile application available on iOS & Android and Pollen Map
BENEFITS
Visual & actionable: a tool designed for everyone to access and understand valuable information
Accurate: a reliable source of information, powered by eLichens’ expertise in air quality sensing and modelling
Ultra local: a state-of-the-art air quality model applied to 300 cities
Mobile application
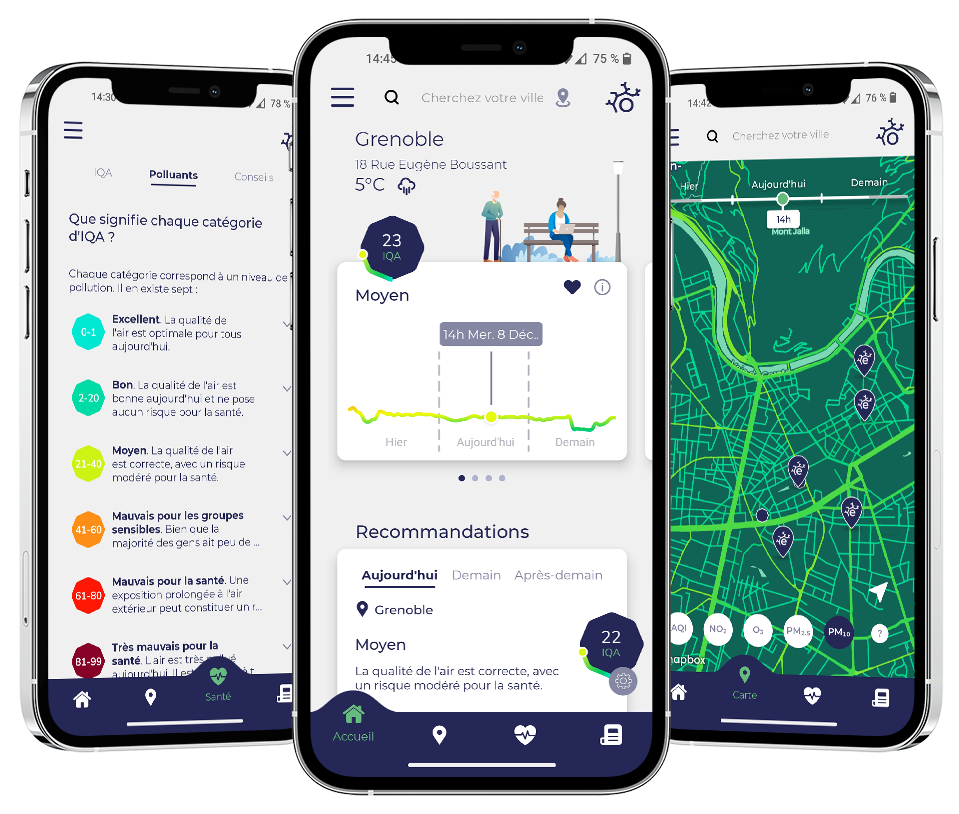
eLichens Air
available on IOS & Android
Discover the air quality everywhere.
eLichens Air mobile app provides you with relevant information of your air quality. Thanks to the AQI (Air Quality Index), the app will let you know if the air quality around you (and your loved ones), is healthy or not. In addition, eLichens advises you on air quality levels (associated with pollutants) and their impact on your health and activities.
The app will give you current, past and forecast air quality everywhere and with an accurate street-level data, available in over 300 cities where the eLichens' hyper-local model is deployed.
Air Quality Widgets
Get customs air quality widgets for your website !
Interested in showing live local Air Quality information to the visitors of your website?
Use one of our 2 free Air Quality widgets by personalizing the following 2 lines of code as indicated below:
The code
<div name="elichenswidget" params="location=MYLOCATION&api_key=MY_API_KEY&unit=MY_UNIT&aqi=MY_AQI&wtype=MY_WIDGET"></div>
<script type="text/javascript" src="https://storage.googleapis.com/elichens-public/widget/v1/load_widget.js"></script>
Instructions
1. Replace MY_LOCATION with the name of the location of your choice (ex: London)
2. Replace MY_API_KEY with your own API key, which you will obtain after signing up here
3. Replace MY_UNIT with “si” if you wish to see the current temperature in °C, or “im” for °F
4. Replace MY_AQI with “elichens” for a global Air Quality Index (AQI), “epa” for the US AQI by the EPA, or “citeair” for the EU AQI
5. Replace MY_WIDGET with “simple” if you’d like the version 1 of the widget, or “complete” if you’d like the version 2
Once completed, copy the code and add it to the code of your webpage.
AIR QUALITY API
The most complete and relevant set of air quality data for any application.

Data
Geolocated Air Quality data
Real-time hourly background AQI (choice between elichens/EPA/Citeair with value, category name and color code provided) & pollutants concentration (PM10, PM2.5, NO2, O3 in mug/m3) all over the world
Real-time hourly hyper-local AQI (resolution up to 5 meters, choice between elichens/EPA/Citeair with value, category and color code) & pollutants concentration (PM10, PM2.5, NO2, O3 in mug/m3) for ~300 major cities all over the world
Real time hourly pollen index (Birch, Grass, Olive, Ragweed; elichens index with value, category name and color code provided) and concentration (in grains/m3) during season in Europe
Up to 4-days forecast
48 hours historical data
Data derived by a patented eLichens algorithms obtained using various inputs including weather data, real-time traffic data, and local air quality agencies data
Hyperlocal cities summary data for 300 major cities all over the world
Hourly street-level pollutants concentration summaries for the location (minimum, maximum, and average value for PM10, PM2.5, NO2, O3)
Up to 24 hours street-level forecast
Historical data starting from October 2020
KEY FEATURES
Global coverage
Up to 60,000 API calls per day
A dedicated customer support
20% discount on each purchase of eLos
BENEFITS
Global: a worldwide coverage without geographical restrictions
Simple: 1 offer with all the pollution and pollen data you must be looking for
Exclusive: a full access to eLichens’ forecasts and hyperlocal model in 300+ major cities
Cost-effective: price below competition
Integrated: complete with local measurements with our outdoor monitor eLos and visualize on our Global Air Quality Map
Questions about the Air Quality Map or API ?
