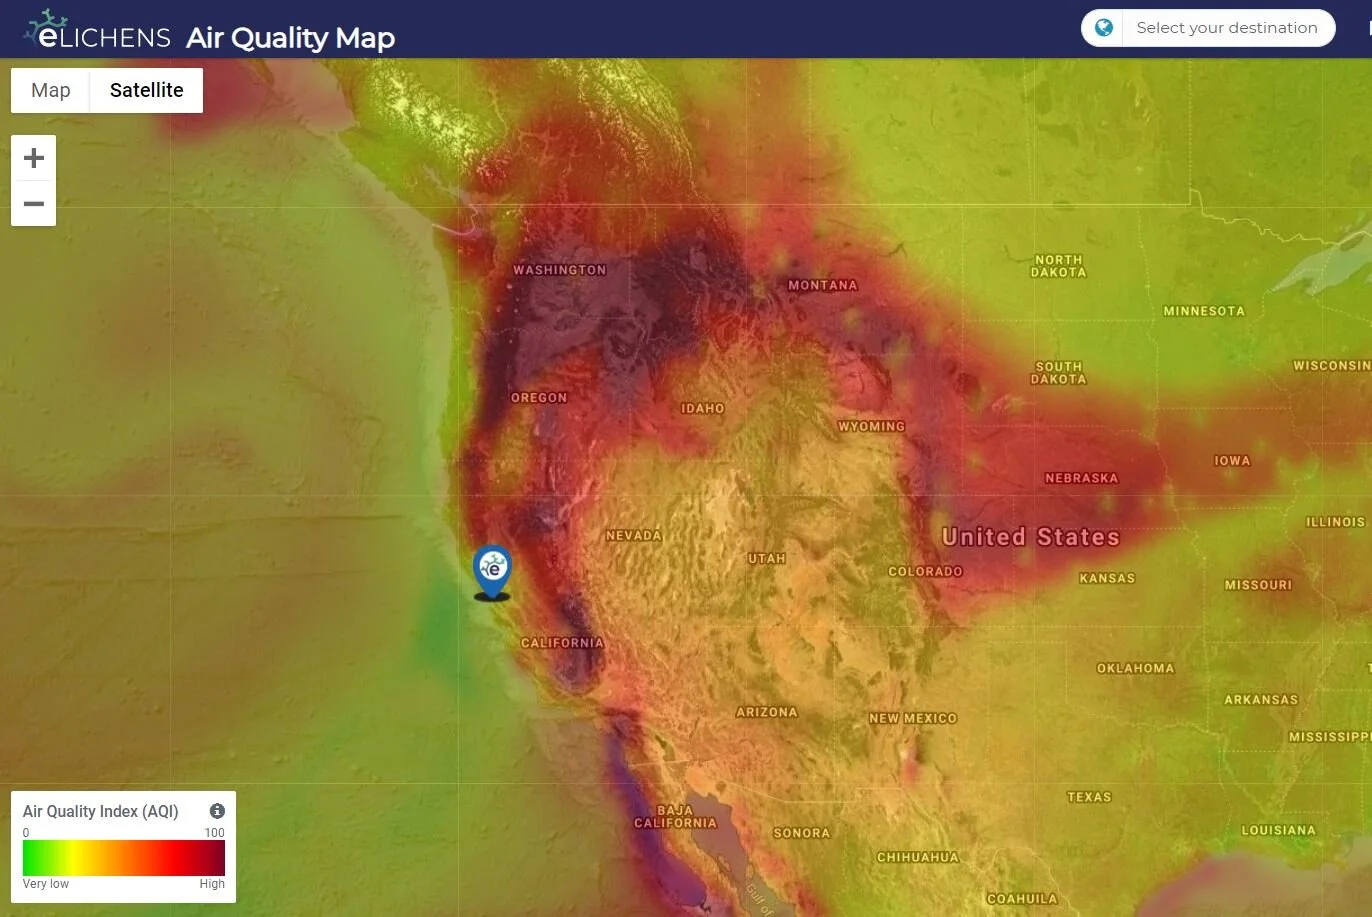

Pictured: pollution map on September 16, 2020. eLichens’ Air Quality Map is a high-resolution map powered by eLichens technology, using our patented models and algorithm to predict the concentration of pollutants at regional and street level
Wildfires have been raging in Western USA for a month now, creating unprecedented waves of severe air pollution that are currently impacting millions of people. Millions of acres have already burnt across the states of Washington, Oregon, and California, but wildfire season is far from over. Only 30% of the perimeter of the August Fire Complex, located in Mendocino National Forest, was contained as of August, 16. It is already the biggest wildfire ever recorded in California. In the meantime in Oregon, the Beach Creek Fire Complex South East of Portland had burnt 190,138 acres as of September 15.
The smokes resulting from the combustion have been carried far from their original source and have impacted Air Quality in a huge area that spreads from British Columbia (Canada) to the North of Mexico. Unhealthy Air Quality has been an issue for individuals living in these regions, including those living in a large and populated urban metropolis like the San Francisco Bay Area, which accounts for almost 8 million people.

Pictured: concentrations of PM2.5 recorded by 15 eLos Outdoor Air Quality Stations in San Francisco between August 8 and September 10, 2020
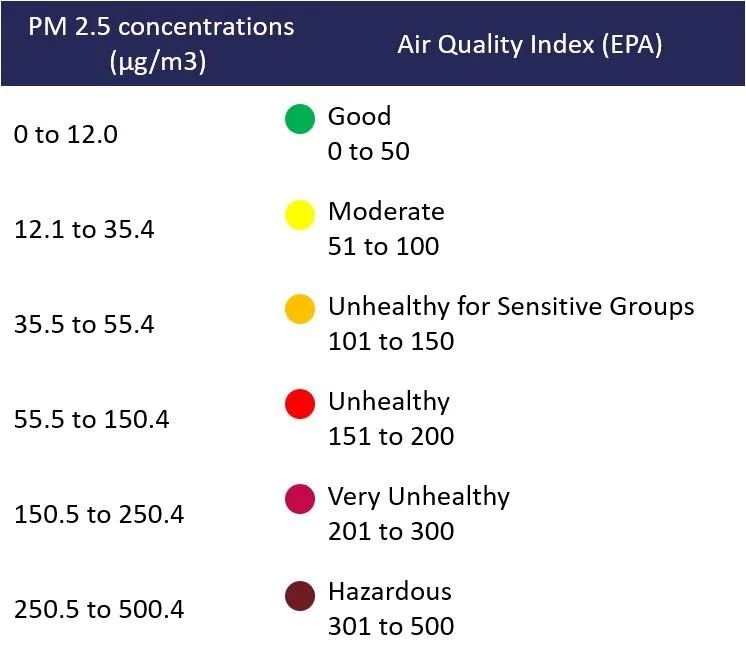
Figure: 24-Hour PM2.5 Levels associated to the U.S. Environmental Protection Agency’s Air Quality Index
Such fires are harmful for humans and animals since they release toxins in the air including particulate matter (PM2.5 and PM10), nitrogen dioxide (NO2), and carbon monoxide (CO). PM2.5, also known as atmospheric aerosol particles, are complex mixtures of small solid and liquid matter that get into the air. PM2.5 refers to those particles with a diameter of 2.5 micrometers or less. They can cause serious heart and lung conditions when inhaled. They have been classified as group 1 carcinogens by the International Agency for Research on Cancer (IARC).
Making accurate Air Quality information accessible for all communities, everywhere

Pictured: eLos Outdoor Air Quality Station by eLichens is solar-powered and includes a dozen Air Quality sensors
eLichens has deployed a dense network of about 15 state-of-the-art Outdoor Air Quality Stations in San Francisco with the objective to monitor real-time pollution very locally at the highest accuracy. eLichens has designed a solution that empowers local communities and organizations in the challenge to improve Air Quality by providing them ultra-local and geo-specific actionable data. Local Air Quality Agencies ran by Governments generally monitor Air Quality thanks to scientific-grade units which cannot be extensively deployed in urban environments given their ominous size, important cost, and due to all the technical requirements for installation and maintenance. Besides, they cannot be owned and used by any organization or citizen willing to monitor pollution and take action.

Pictured: eLichens’ Air Quality Map uses data from eLos Outdoor Air Quality Stations by eLichens to provide the most accurate pollution and environmental data at a street level. 1, 2 and 3 refer to the table below.
eLos can be installed anywhere needed and by anyone in less than 10 minutes. Fully autonomous, eLos is solar-powered and therefore does not need to be linked to any power source. Once installed, it monitors and communicates hourly concentrations of pollutants such as particulate matter (PM1, PM2.5, PM10), nitrogen dioxide (NO2), ozone (O3) as well as climate parameters such as temperature, pressure, humidity level. Embedded recalibration algorithms ensure a high quality of measurements over years.
Tracking ultra-local pollution with a dense network of Air Quality stations
Levels of PM2.5 have peaked across the city lately, and the thick and unhealthy smokes have forced residents to avoid outdoor exertion in the San Francisco Bay Area. Citizens have adapted their lifestyle to remain healthy, and the most fragile members of the society have been encouraged to stay at home through daily text guidelines that applied for the whole City and County of San Francisco. However, hazardous pollution peaks have been recorded by eLos stations at each location with very different intensities and at different times, highlighting the importance of localized monitoring to quickly call for locally adapted actions and better protect all community members.
On August 19, the Bayview area (South East of the city, along the Bay) has been much more exposed to unhealthy smokes coming from inland California than the inner city (West), where levels of particulate matter remained moderate and unharmful for the population. Most neighborhoods saw very high rises in PM2.5 concentrations around September 11, when smokes were pushed by Northern winds from Oregon and Northern California. However, the concentrations doubled depending on the area.
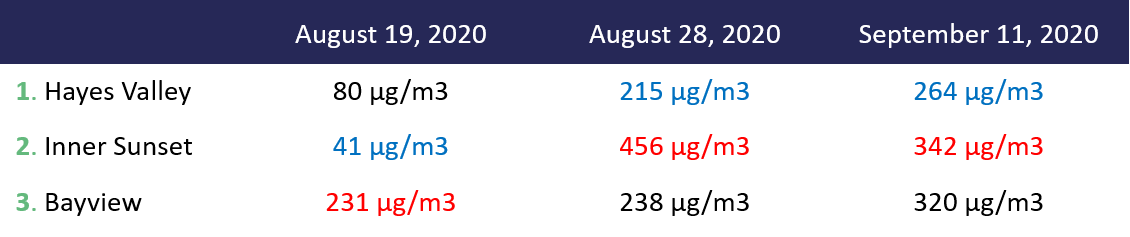
Figure: PM2.5 concentrations monitored by eLos at 3 different points during 3 pollution peaks. For each peak day, the location with the minimum (blue) and the maximum (red) concentration has been highlighted.
As the safety and health of so many citizens are at stake, decision-making is key and must be done based on the most accurate and local real-time information, especially when the situation is rapidly fluctuating due to the advance of fires and their containment, the change of winds and other climatic aspects. Besides, the plethora of contradictory forecasts and the confusion it creates proves how crucial it is to base all guidelines and actions on measured data rather than predictions. eLichens provides an essential tool to raise awareness through data, take relevant actions and become involved in the fight to improve local and global Air Quality.